The more often a support level is tested but not broken, then: the stronger that level becomes
What Is Resistance in Crypto?
Function of Resistance
Resistance is the opposite of support, which is a price level where selling pressure is stronger so the price:
- Stops rising
- Has the potential to fall
Characteristics of Resistance
- Becomes a “psychological barrier” for the market
- Many traders take profit in this area
- Often becomes a reversal point
Simple Example
- ETH price rises to 2,000 multiple times but always falls
- → meaning 2,000 is resistance
Important Insight
The more often price fails to break through resistance: the greater the possibility that price will fall from that area
How to Determine Support and Resistance Lines on a Chart
For beginners, here are the most practical steps:
1. Use the Right Timeframe
Start with:
- 1H (scalping ringan)
- 4H (trading)
- 1D (swing/investasi)
2. Look for Price Bounce Points
Pay attention to:
- Repeated lowest points → support
- Repeated highest points → resistance
3. Draw Horizontal Lines
Use line tools on the chart:
- Connect at least 2–3 points
- Do not be too precise (treat it as a zone, not a thin line)
4. Focus on Areas, Not Numbers
Support & resistance are: zones, not one exact number
Types of Support & Resistance
1. Horizontal Support & Resistance
This is the most common:
- Based on price history
- Easy for beginners to recognize
2. Trendline Support & Resistance
Formed from diagonal lines:
- Uptrend → rising support line
- Downtrend → falling resistance line
3. Dynamic Support & Resistance
Changes according to indicators:
- Moving Average
- EMA
Example:
- MA 50 often becomes support during an uptrend
How to Read Signals at Support & Resistance Areas
1. Bounce
Price touches a level then reverses direction
➡️ Strategy:
- Buy at support
- Sell at resistance
2. Breakout
Price strongly breaks through a level
➡️ Strategy:
- Buy when resistance is broken
- Sell when support is broken
3. Fake Breakout (False Break)
Price briefly breaks through but then returns again
➡️ This is a common trap!
Characteristics:
- Low volume
- Weak candle
- Quickly returns to the previous area
Simple Strategies Using Support & Resistance
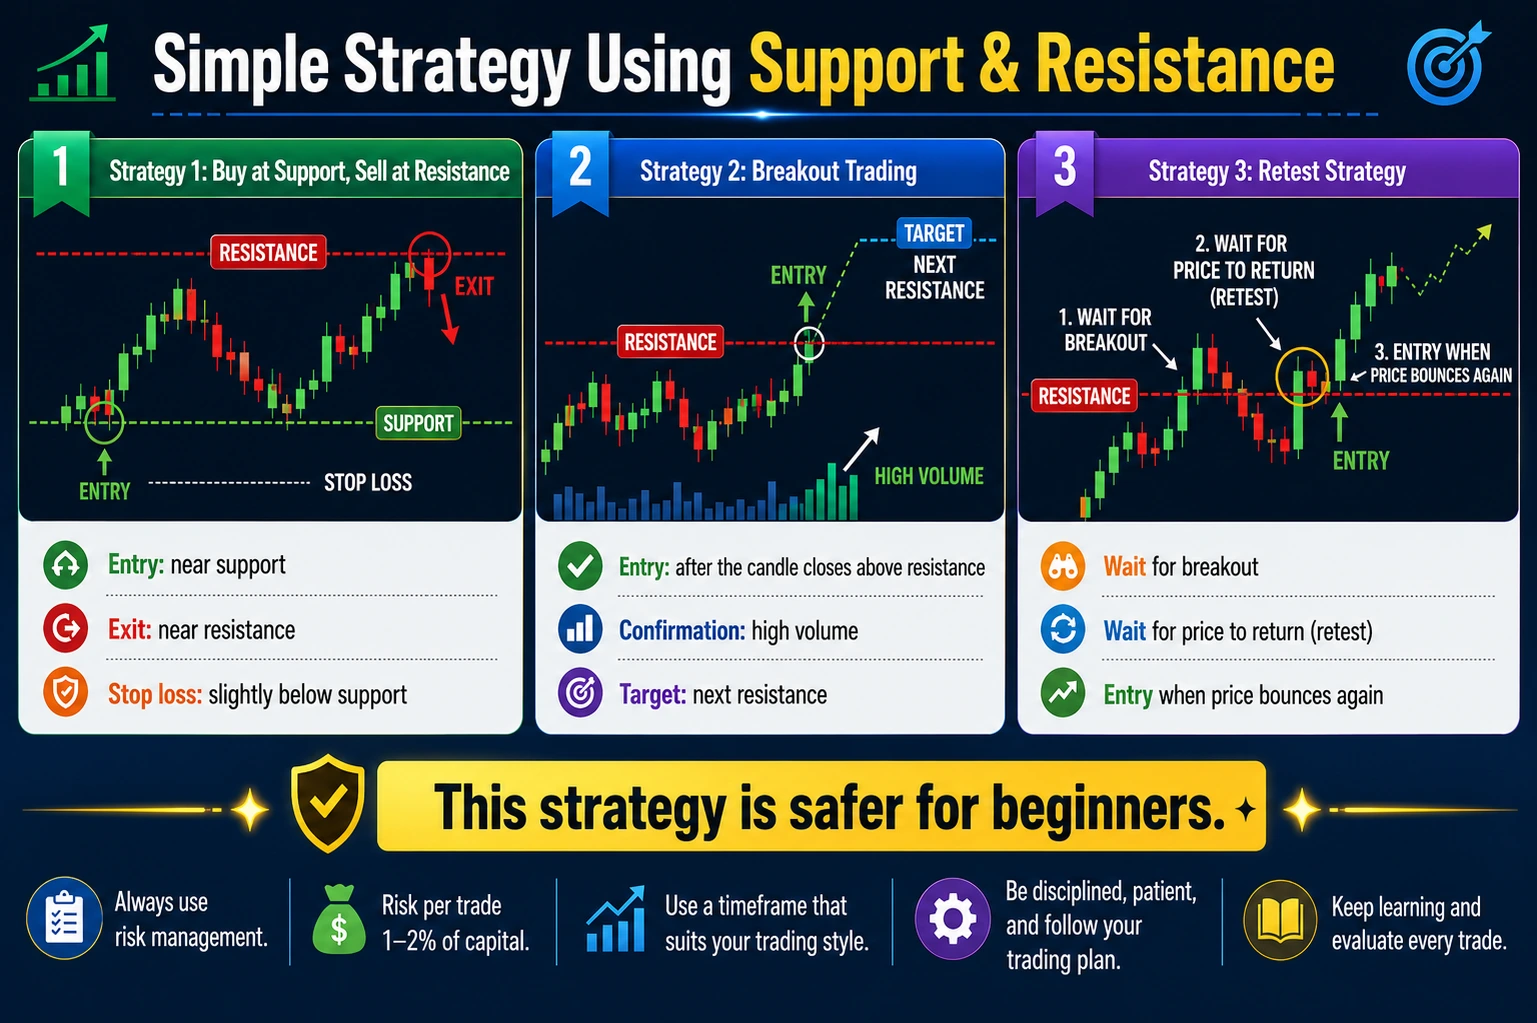
Strategy 1: Buy at Support, Sell at Resistance
- Entry: near support
- Exit: near resistance
- Stop loss: slightly below support
Strategy 2: Breakout Trading
- Entry: after candle closes above resistance
- Confirmation: high volume
- Target: next resistance
Strategy 3: Retest Strategy
- Wait for breakout
- Wait for price to return (retest)
- Entry when price bounces again
This strategy is safer for beginners.
Combining with Other Indicators
Support & resistance become stronger when combined with:
1. Moving Average
- MA 50 / MA 200 as dynamic support/resistance
- Trend confirmation
(Read also: Moving Average Crypto)
2. Volume
- Valid breakout → high volume
- Fake breakout → low volume
3. RSI (Relative Strength Index)
- RSI oversold + support → strong buy signal
- RSI overbought + resistance → sell signal
(Read also: Crypto Trading Indicators)
Common Mistakes When Using Support & Resistance
❌ Being Too Precise
Treating levels as exact numbers. In reality, they are zones
❌ Not Using Volume
Breakout without volume = prone to fake breakout
❌ Trading Without Confirmation
Entering immediately just because price touches a level
❌ Overtrading
Entering too often without a clear strategy
❌ Not Using Stop Loss
This is a fatal mistake for beginners
To improve your skills further, also learn
- How to Read Crypto Charts
- Moving Average Crypto
- Crypto Trading Indicators
- Daily Crypto Trading Strategies
- Safe Crypto Investment Methods
- How to Evaluate Crypto Projects
Conclusion
Support and resistance are the main foundation of crypto technical analysis.
By understanding:
- Where price tends to stop
- Where reversals may happen
- When to enter and exit
You are no longer trading based on feelings, but based on data and market structure.
FAQ (Frequently Asked Questions)
1. Are support and resistance always accurate?
No. They are probabilities, not certainties. Always use additional confirmation.
2. What is the best timeframe for beginners?
Start with 4H or 1D so signals are clearer and less noisy.
3. Can it be used for all crypto assets?
Yes, it applies to all markets:
- Bitcoin
- Altcoins
- Even stocks & forex
4. How many points are needed at minimum to determine a level?
Minimum 2 points, ideally 3 or more.
5. Can support become resistance?
Yes! This is called:
➡️ Role reversal
- Broken support → becomes resistance
- Broken resistance → becomes support
Before buying any crypto asset, make sure you have:
- Determined the support area (buy)
- Determined the resistance area (sell)
- Used additional confirmation such as volume and indicators
With this approach, you can analyze opportunities more objectively—including when evaluating the potential of tokens like DRX Token.
Stop buying because of FOMO.
Use support and resistance as your main analysis foundation for more strategic and measurable trading and investing.


