A candlestick is a representation of price movement within a certain period.
- Body → open & close price
- Wick (shadow) → higher & lower price
- Hijau → price goes up
- Merah → price goes down
This is the main foundation of technical analysis of crypto.
2. Timeframe
Shows the duration of each candlestick:
- 1 minute → scalping
- 1 hour → intraday
- 1 day → swing trading
Tips: beginners should focus on the 1H or 4H timeframe so it is not too “noisy”.
3. Trend (Market Direction)
- Uptrend → higher high & higher low
- Downtrend → lower high & lower low
- Sideways → stagnant price
Do not go against the trend. This is a classic beginner mistake.
4. Support & Resistance
- Support → price area where it often bounces up
- Resistance → price area where it often gets rejected down
This is important to determine:
- Entry (buy)
- Exit (sell)
5. Volume
Volume shows the strength of price movement.
- Volume increase + price increases → strong trend
- Low volume → potential fake move
Step-by-Step Tutorial on How to Read Crypto Chart (MANDATORY)
Here is a practical guide you can apply immediately:
Step 1: Choose a Chart Platform
Use platforms such as:
- TradingView
- Binance
- Bybit
Tips: Use TradingView for analysis because it is more complete.
Step 2: Determine the Timeframe
Start from:
- 1H (safe for beginners)
- 4H (more stable)
Avoid small timeframes if you are not experienced yet.
Step 3: Identify the Trend
Look at the pattern:
- Is the price trending up?
- Down?
- Or sideways?
Use simple trend lines to help visualization.
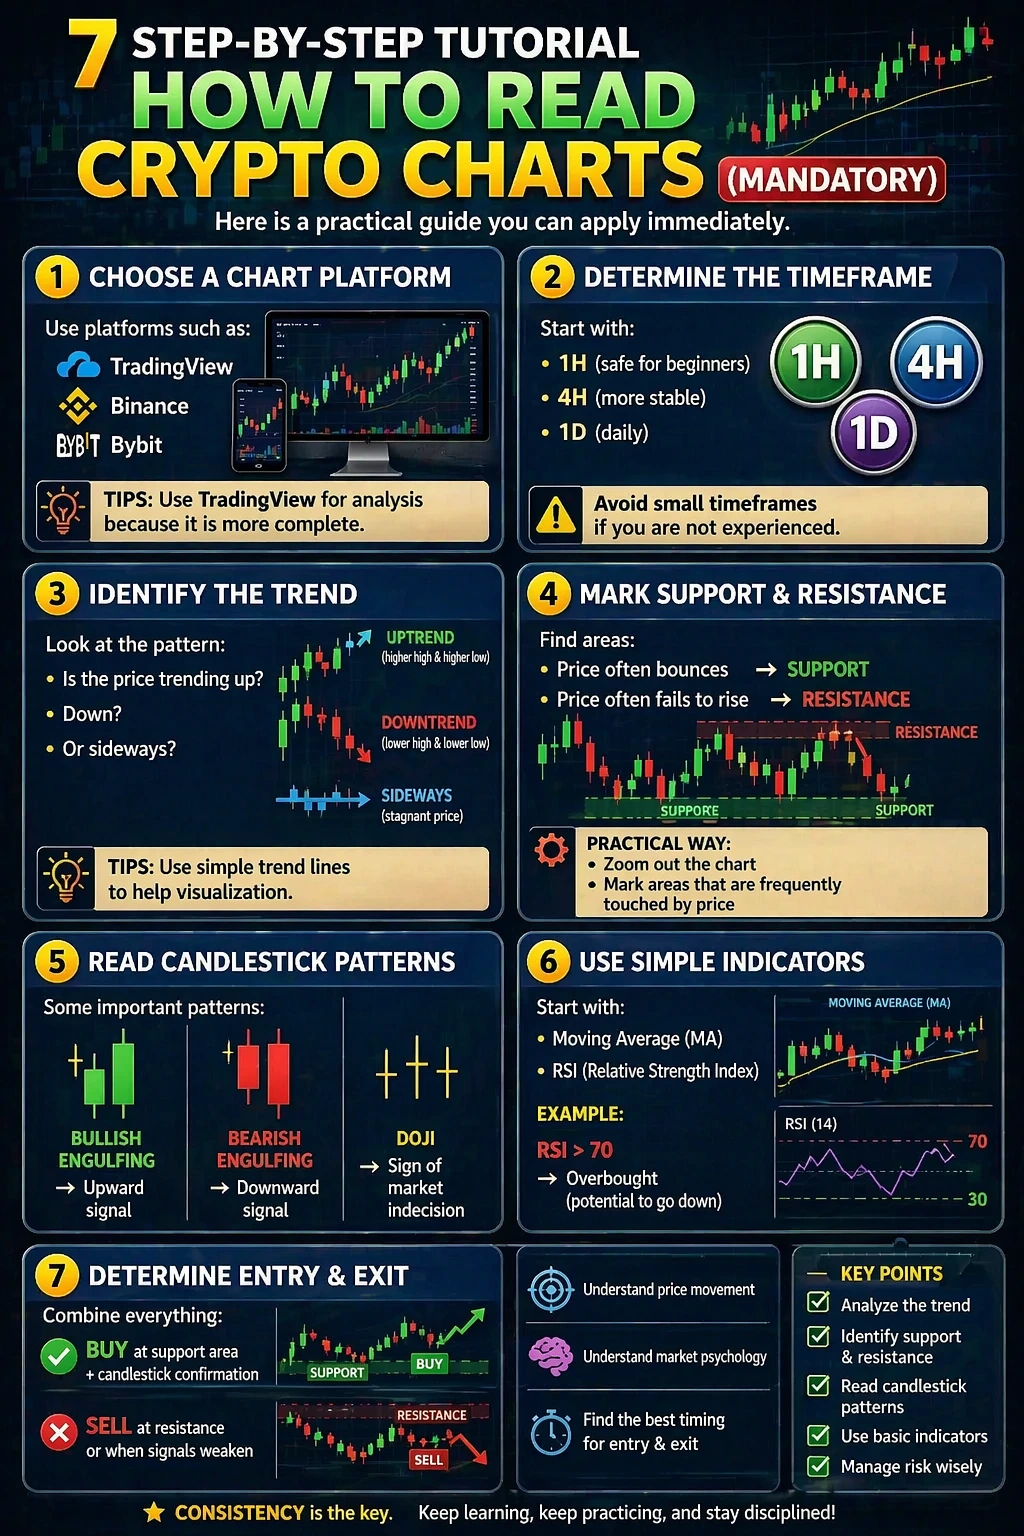
Step 4: Mark Support & Resistance
Find areas:
- Price often bounces → support
- Price often fails to go up → resistance
Practical way:
- Zoom out the chart
- Mark areas that the price touches frequently
Step 5: Read Candlestick Patterns
Some important patterns:
- Bullish engulfing → upward signal
- Bearish engulfing → downward signal
- Doji → sign of market indecision
Step 6: Use Simple Indicators
Start with:
- Moving Average (MA)
- RSI (Relative Strength Index)
Example:
- RSI < 30 → oversold (potential to price)
- RSI > 70 → overbought (potential to fall)
Step 7: Determine Entry & Exit
Combine everything:
- Buy the area support + candlestick confirmation
- Sell at resistance or when signals weaken
This is the core of all strategies in how to read crypto charts
Practical Tips to be More Accurate
Here are tips that can directly improve your skills:
1. Focus only on 1-2 indicators
Do not overcomplicate.
2. Utilized multi-timeframe
Check:
- Major trend (4H / Daily)
- Minor entry (1H)
3. Always utilize stop loss
Without this, your account may be wiped out quickly.
4. Do not FOMO
If you miss an entry, wait for the next setup.
5. Combine with fundamentals
Learn how to evaluate crypto projects for more solid decisions.
Common Mistakes to Avoid
There are many trades that fail because of the following reasons:
❌ 1. Trading without a plan
Entering the market without a strategy = gambling.
❌ 2. Overtrading
Entering too often → cost & risk increase.
❌ 3. Relying only on one indicator
The market is not that simple.
❌ 4. Not understanding the risk management
This is more important than profit.
❌ 5. Trust the “signal group” too much
Learning independently is much stronger.
Conclusion
How to read crypto charts is not just about looking at graphs, but understanding:
- Price movement
- Market psychology
- The best timing for entry & exit
If you consistently apply:
- Trend analysis
- Support & resistance
- Candlestick
- Basic indicators
Then your chances of profit will increase significantly.
Start Practicing with Assets That Have Potential
After understanding the basics of charts, the next step is to choose the right assets.
One example you can study is:
DRX Token Prospect This Year
Why is it important?
Because the combination of:
- Chart analysis (technical)
- Project quality (fundamental)
Will give you a big edge in the market.
FAQ (Frequently Asked Questions)
1. Is reading crypto charts difficult for beginners?
No, if you start from the basics like candlesticks, trends, and support/resistance.
2. How long does it take to learn how to read charts?
On average:
- 1–2 weeks → understand the basics
- 1–3 months → start to be consistently profitable
3. Best indicators for beginners?
- Moving Average
- RSI
- Start with the simple one first
4. Can charts be 100% accurate?
No. Charts are probability tools, not certainty.
5. Is it mandatory to learn technical analysis?
Very necessary if you want to trade, especially in technical analysis of crypto.
6. Which is more important, technical or fundamental?
Both are important:
- Technical → timing
- Fundamental → asset quality
7. Can you profit only from reading charts?
Yes, but it will be stronger if combined with strategy and risk management.


