This pattern appears on more than just Bitcoin (BTC) and Ethereum (ETH) charts, but also on almost all financial assets—stocks, forex, and commodities. However, in the crypto world, high volatility makes the Triangle Pattern an important indicator for swing traders and scalpers.
Types of Triangle Pattern
In general, there are three main types of Triangle Patterns in technical analysis:
1. Ascending Triangle (Upward Triangle)
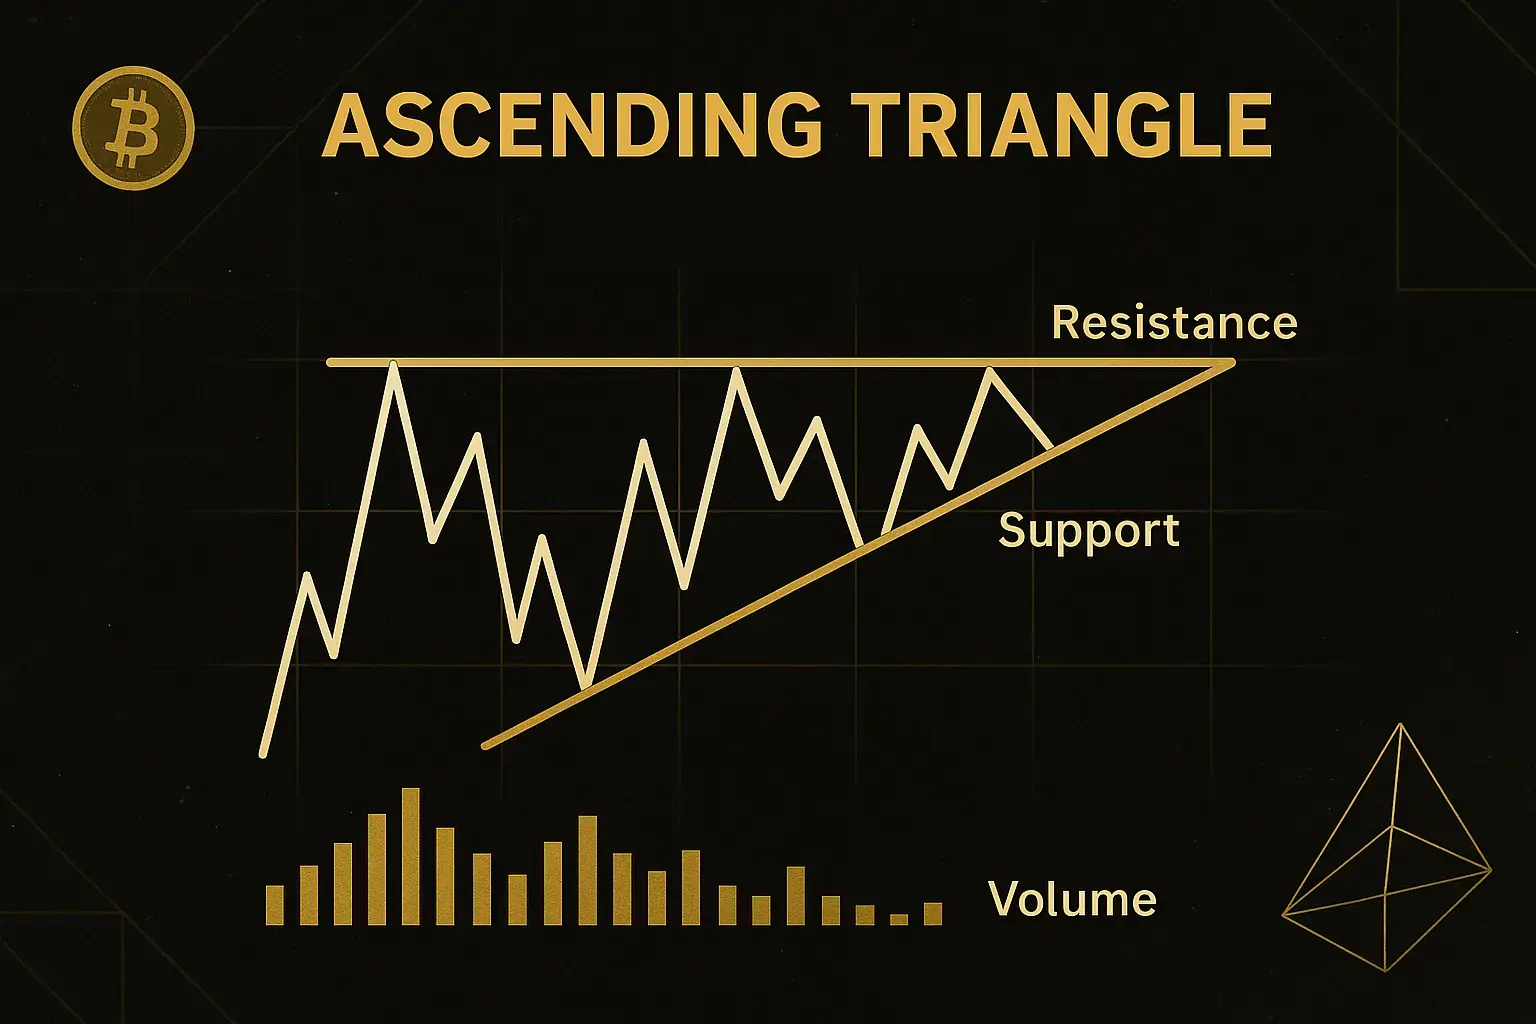
Key characteristics:
- The resistance line (top) is flat.
- The support line (bottom) slopes upward.
- Trading volume tends to decline as the pattern forms.
Psychological meaning:
Buyers consistently push prices higher, even though sellers manage to hold at the same resistance level. This indicates increasing buying pressure, signaling a potential bullish breakout.
Case study:
Bitcoin formed an ascending triangle several times ahead of its bull run, including at the end of 2020, before the price broke through the $20,000 level. After consolidating in that area for weeks, volume surged and prices shot up, confirming the bullish signal formed by an ascending triangle pattern.
2. Descending Triangle (Downward Triangle)
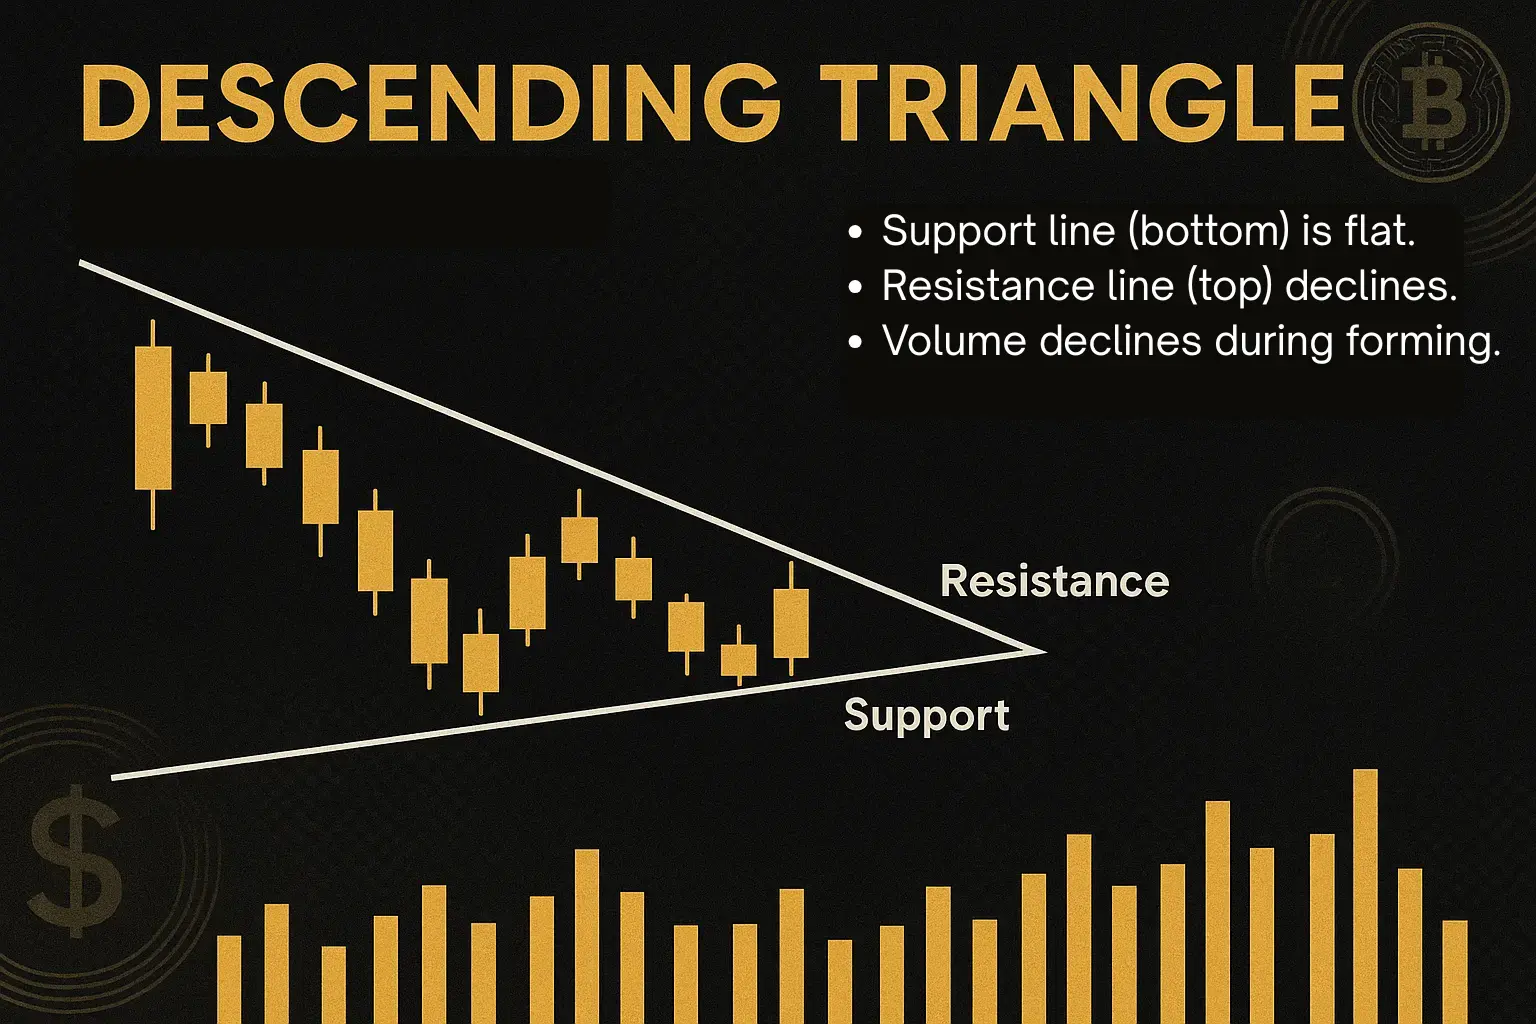
Key characteristics:
- The support line (bottom) is flat.
- The resistance line (top) is declining.
- Volume also declines during formation.
Psychological meaning:
Unlike the ascending triangle, this pattern indicates increasing selling pressure. Sellers gradually lower the peak price, while buyers can only maintain the same support level. When that support is finally broken, prices usually fall further, marking a bearish breakout.
Case study:
During the 2018 bear market, many major altcoins, such as Ethereum and XRP, formed descending triangles that ended in sharp declines. Traders who recognized this pattern early on were able to anticipate the price decline before the major breakdown occurred.
3. Symmetrical Triangle
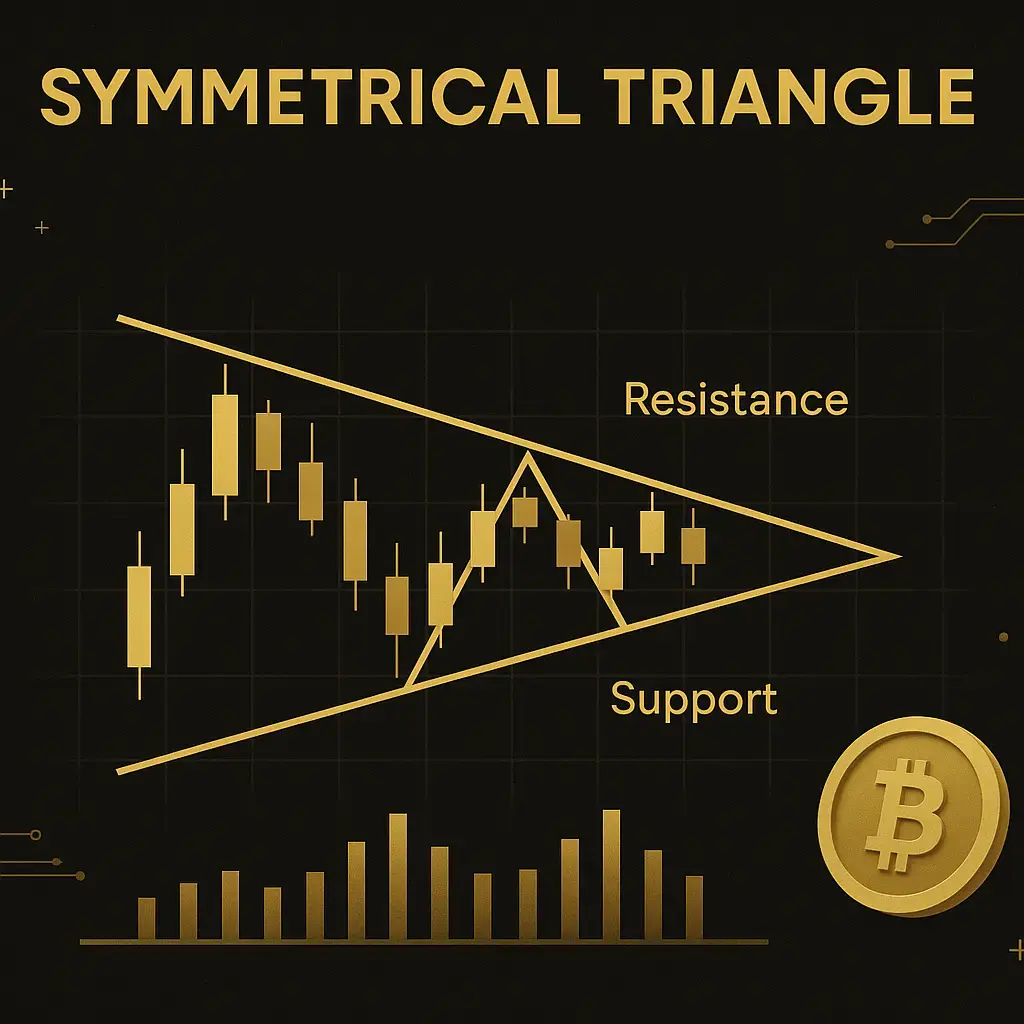
Key characteristics
- Both sides (support & resistance) narrow symmetrically.
- No clear bias to a certain direction.
- Volume gradually decreases before the breakout.
Psychological meaning:
The market is in a balanced position. Both bull and bear are waiting for confirmation of the next direction. Therefore, the symmetrical triangle is often referred to as a neutral pattern — the final outcome depends on the direction of the breakout.
Case study:
During periods of high volatility, such as in May 2021, Bitcoin formed a symmetrical triangle in the $35,000–$40,000 range. After weeks of consolidation, volume surged sharply and prices broke down, marking the start of a medium-term bearish trend.
How to Identify a Triangle Pattern on the Chart
To correctly identify a Triangle Pattern, traders need to pay attention to three main elements:
1. Two converging trend lines.
- The resistance line is drawn from gradually declining price peaks.
- The support line is drawn from gradually inclining troughs (or vice versa, depending on the type of triangle).
2. Declining trading volume
During the triangle formation phase, volume usually decreases, indicating that the market is waiting for a decision on which direction to take.
3. Breakout with high volume
When the price breaks through one side of the triangle (top or bottom), a valid breakout confirmation is usually followed by a significant surge in volume.
Practical tips: Use additional indicators such as RSI and MACD to strengthen the signal. If the RSI increases along with an upward breakout, the potential for an increase becomes more valid.
Trading Strategies Using the Triangle Pattern
The Triangle Pattern is not just a visual pattern; it can serve as the basis for a measured entry and exit strategy. Here is a step-by-step guide:
1. Entry Point
- Wait until the price completely breaks through one side of the triangle with a clear candle close.
- Confirm using high volume without volume, as it is likely just a false breakout.
2. Set a Profit Target
- Measure the highest vertical distance of the triangle (high–low) at the beginning of the pattern formation.
- Project the distance from the breakout point to estimate a potential price target.
Example:
If the triangle height is $500 and breakout occurs at $10,000, then the next price target is around $10,500 for a bullish breakout.
3. Stop-Loss
- For a bullish breakout, place the stop-loss below the old resistance line (which is now support).
- For a bearish breakout, place the stop-loss above the old support line (which is now resistance).
Real Examples of a Triangle Pattern in the Crypto Market
Let's look at two of the most commonly used examples:
1. BTC/USD – Ascending Triangle (December 2020)
During consolidation between $18,000–$20,000, Bitcoin formed an ascending triangle pattern with strong resistance at the $20,000 level. Volume declined over time, but once the breakout occurred at the end of December, volume surged — propelling BTC to break through its all-time high to $30,000 in just a few weeks.
2. ETH/USD – Symmetrical Triangle (2021)
In early 2021, Ethereum moved within a symmetrical triangle pattern between $1,700–$2,000. After a 2-week consolidation phase, an upward breakout occurred with high volume, propelling ETH up over 40% in a short period.
Both examples demonstrate the Triangle Pattern functions not just as a technical analysis tool, but also as a reflection of market psychology—how market participants wait on each other, then react simultaneously when a new direction emerges.
Pros and Cons of the Triangle Pattern
Pros
- Easy to recognize—its shape is distinctive and often appears across various timeframes.
- Provides a strong signal—especially if the breakout is accompanied by a surge in volume.
- Flexible—can be used in all types of markets and timeframes.
Cons
- False breakouts often occur, especially in volatile crypto markets.
- Requires patience—patterns can take days or weeks to form.
- Not always conclusive—especially in symmetrical triangles, where the direction of the breakout cannot be predicted.
Triangle Pattern vs Other Patterns: Flag, Pennant, and Wedge
The Triangle Pattern is often likened to other technical patterns. Below is a brief summary of their differences.
| Pattern | Key Characteristics | Duration | Bias Trends |
| Triangle | Consolidation with converging trend lines | Moderate-long | Neutral/continuous |
| Pennant | Mini-triangle after a price surge | Short | Continuous |
| Flag | A slanted rectangular pattern after a rally | Short | Continuous |
| Wedge | A sharp and slanted trend line | Long | Reversal |
Professional Tips: Avoiding False Breakouts
Even experienced traders can be fooled by false breakouts. Here are some ways to minimize them:
- Wait for the closing candle outside the pattern, not just the wick.
- Make sure the volume increases significantly when the breakout occurs.
- Confirm momentum using indicators such as RSI > 60 (for bullish) or RSI < 40 (for bearish).
- Avoid using high leverage before the direction is confirmed.
- Apply strict risk management — maximum risk of 1–2% of capital per position.
Conclusion
The Triangle Pattern is one of the most reliable technical patterns for detecting potential breakouts in the crypto market. Whether ascending, descending, or symmetrical, all three indicate that the market is in a “calm before the storm” phase.
By understanding how to recognize, confirm, and execute strategies based on this pattern, traders can increase their profitability while avoiding false signals.
Ultimately, the Triangle Pattern is not just a shape on a chart; it is a reflection of the collective psychology of the cryptocurrency market. When the tension between buyers and sellers reaches its peak, the triangle marks the birth of a new trend.
For a deeper understanding of how volatility affects patterns, read our article on volatility to gain a deeper understanding of the dynamics of cryptocurrency price shifts.


